How much is your Austin home worth?
- Instant property valuation
- Expert advice
- Sell for more
Loading valuation...
Real Estate Johnny Ronca September 27, 2026
How much is your Austin home worth?
Schedule a free consultation with a top local agent who can help you estimate and understand your home's value.
We need more information to provide an accurate estimate for this address. Local expert will reach out shortly or you can schedule a consultation now.
The 15-Second Answer
Austin luxury split in two in 2026: well-priced homes are selling faster and closer to asking price, while the largest and most expensive homes are taking longer and selling for less per foot. In Westlake 78746, Q3 median days on market fell from 61 to 30. In 78704, homes of 2,300–3,500 sq ft now sell in 34 days at 93.5% of original list, while 3,500–5,500 sq ft homes lost about 21% per foot. On Lake Austin, waterfront price per foot rose 12.9% but market time more than doubled, while on Lake Travis matched waterfront homes sold 24 days faster. Pricing is now the whole game.
I'm Johnny Ronca, Luxury Associate Broker with SERHANT. in Austin. I have 20+ years in this market, 300+ closings and $250M+ in sales. Every quarter I pull closed sales straight from Unlock MLS (ACTRIS) and compare matched homes year over year: same ZIP, same size band, same bedroom and bath count. That matters. An unmatched median mostly tells you which houses happened to sell. A matched one tells you what the market actually did.
This is my Q3 2026 read on Austin luxury and waterfront real estate. Every figure below is a closed single-family sale from Unlock MLS, and every cohort was checked for completeness before I used it. Where a sample is small, I say so.
It stopped moving as one market. Mid-size luxury homes in the best locations tightened: fewer days on market, smaller discounts off the original asking price. The biggest, most expensive homes went the other way. You can see both trends inside a single ZIP code, 78704, in the same nine months.
The three clearest signals this quarter:
For well-priced homes, yes, and it is faster than it was a year ago. Here is Q3 against Q3, all 78746 single-family closings:
78746 closed sales | Q3 2025 | Q3 2026* |
|---|---|---|
Sales | 68 | 63 |
Median close | $1,872,500 | $1,950,000 |
Median $/sq ft | $561 | $573 |
Median days on market | 61 | 30 |
Close ÷ original list | 88% | 93% |
*Q3 2026 through Sept 22, 2026. Source: Unlock MLS (ACTRIS) closed single-family sales.
The median price is up about 4% and price per foot about 2%. The bigger change is in terms: homes sell in half the time, and sellers keep roughly five more points of their original asking price. Supply backs this up. On Sept 22, 78746 had 99 active listings, about 4.4 months of supply, which is balanced to slightly seller-leaning. For neighborhood detail, see my Eanes ISD neighborhood guide and the full Westlake 78746 market report.
Johnny's Off Market Private Luxury Listings
21 off-market pocket listings in Westlake and Eanes ISD right now
As of Sept 23, 2026. Tell me your price range and must-haves and I'll send what matches. Call or text 512-797-0965.
Buyers are paying up for well-located mid-size homes and pushing back hard on very large ones. These are matched cohorts (3+ bedrooms, 2+ baths, same size band) comparing all of 2025 with 2026 through Sept 25:

78704 matched homes | Median close | $/sq ft | Days on market | Close ÷ orig. list |
|---|---|---|---|---|
2,300–3,500 sq ft · 2025 (104 sales) | $1,662,500 | $601.78 | 52 | 89.8% |
2,300–3,500 sq ft · 2026 (78 sales) | $1,782,500 | $625.16 | 34 | 93.5% |
3,500–5,500 sq ft · 2025 (28 sales) | $2,937,500 | $781.85 | 67 | 89.5% |
3,500–5,500 sq ft · 2026 (23 sales) | $2,550,000 | $619.38 | 84 | 89.1% |
Built 2020+ · 2025 (73 sales) | $2,078,500 | $656.42 | 80 | 90.0% |
Built 2020+ · 2026 (52 sales) | $2,142,000 | $650.00 | 46 | 92.5% |
2026 = Jan 1–Sept 25, 2026. Counts cover nine months against twelve, so compare medians and ratios, not sale counts.
The mid-size band moved the same direction on all four measures: price up 7.2%, price per foot up 3.9%, market time down by a third, discounts smaller. The large band fell 13% on median price and about 21% per foot. That band is small (28 and 23 sales), so treat it as a clear direction rather than a precise number. New construction held its price per foot and sold in 46 days instead of 80, but the typical new build got smaller (3,246 to 2,931 sq ft). Builders are delivering the size buyers are paying for.
My advice to any 78704 seller: half of 2025's mid-size sales closed at or below 89.8% of the original ask. In 2026 that gap is 6.5 points. Priced right, you get close to asking. Priced high, you still chase the market down. More on the neighborhoods inside the ZIP in my South Central Austin 78704 guide.
Johnny's Off Market Private Luxury Listings
16 off-market pocket listings in South Central Austin right now
As of Sept 23, 2026. Tell me your price range and must-haves and I'll send what matches. Call or text 512-797-0965.
Prices per foot eased about 6% in Barton Hills, but homes still sell in about a month. Barton Hills closed 27 single-family homes in 2025 and 25 in 2026 through Sept 27.

Barton Hills (78704), all single-family | 2025 | 2026 |
|---|---|---|
Sales | 27 | 25 |
Median close | $1,775,000 | $1,480,000 |
Median $/sq ft | $658.54 | $619.24 |
Median size | 2,693 sq ft | 2,450 sq ft |
Median days on market | 32 | 33 |
Close ÷ original list | 93.5% | 91.3% |
The median price fell more than the price per foot because smaller homes sold this year. Price per foot, down 6.0%, is the fair read. Zilker is platted as many small subdivisions, so only 8 homes carry a "Zilker" subdivision name in the MLS across both years. That is too few for a median, so for the bigger picture use 78704 as a whole: matched 2,300–3,500 sq ft homes across the ZIP rose 3.9% per foot this year and sold in 34 days. I track Zilker street by street for clients. I've lived in 78704 for well over a decade. More in my Barton Hills guide and Zilker guide.
Johnny's Off Market Private Luxury Listings
8 off-market pocket listings in Zilker and Barton Hills right now
As of Sept 23, 2026. Tell me your price range and must-haves and I'll send what matches. Call or text 512-797-0965.
East Austin's $1 million-plus tier is selling faster than almost anywhere in this report. In ZIP 78702, homes over $1 million sold in a median 20 days in 2026, down from 55.5 days in 2025, at 95.3% of original list price.
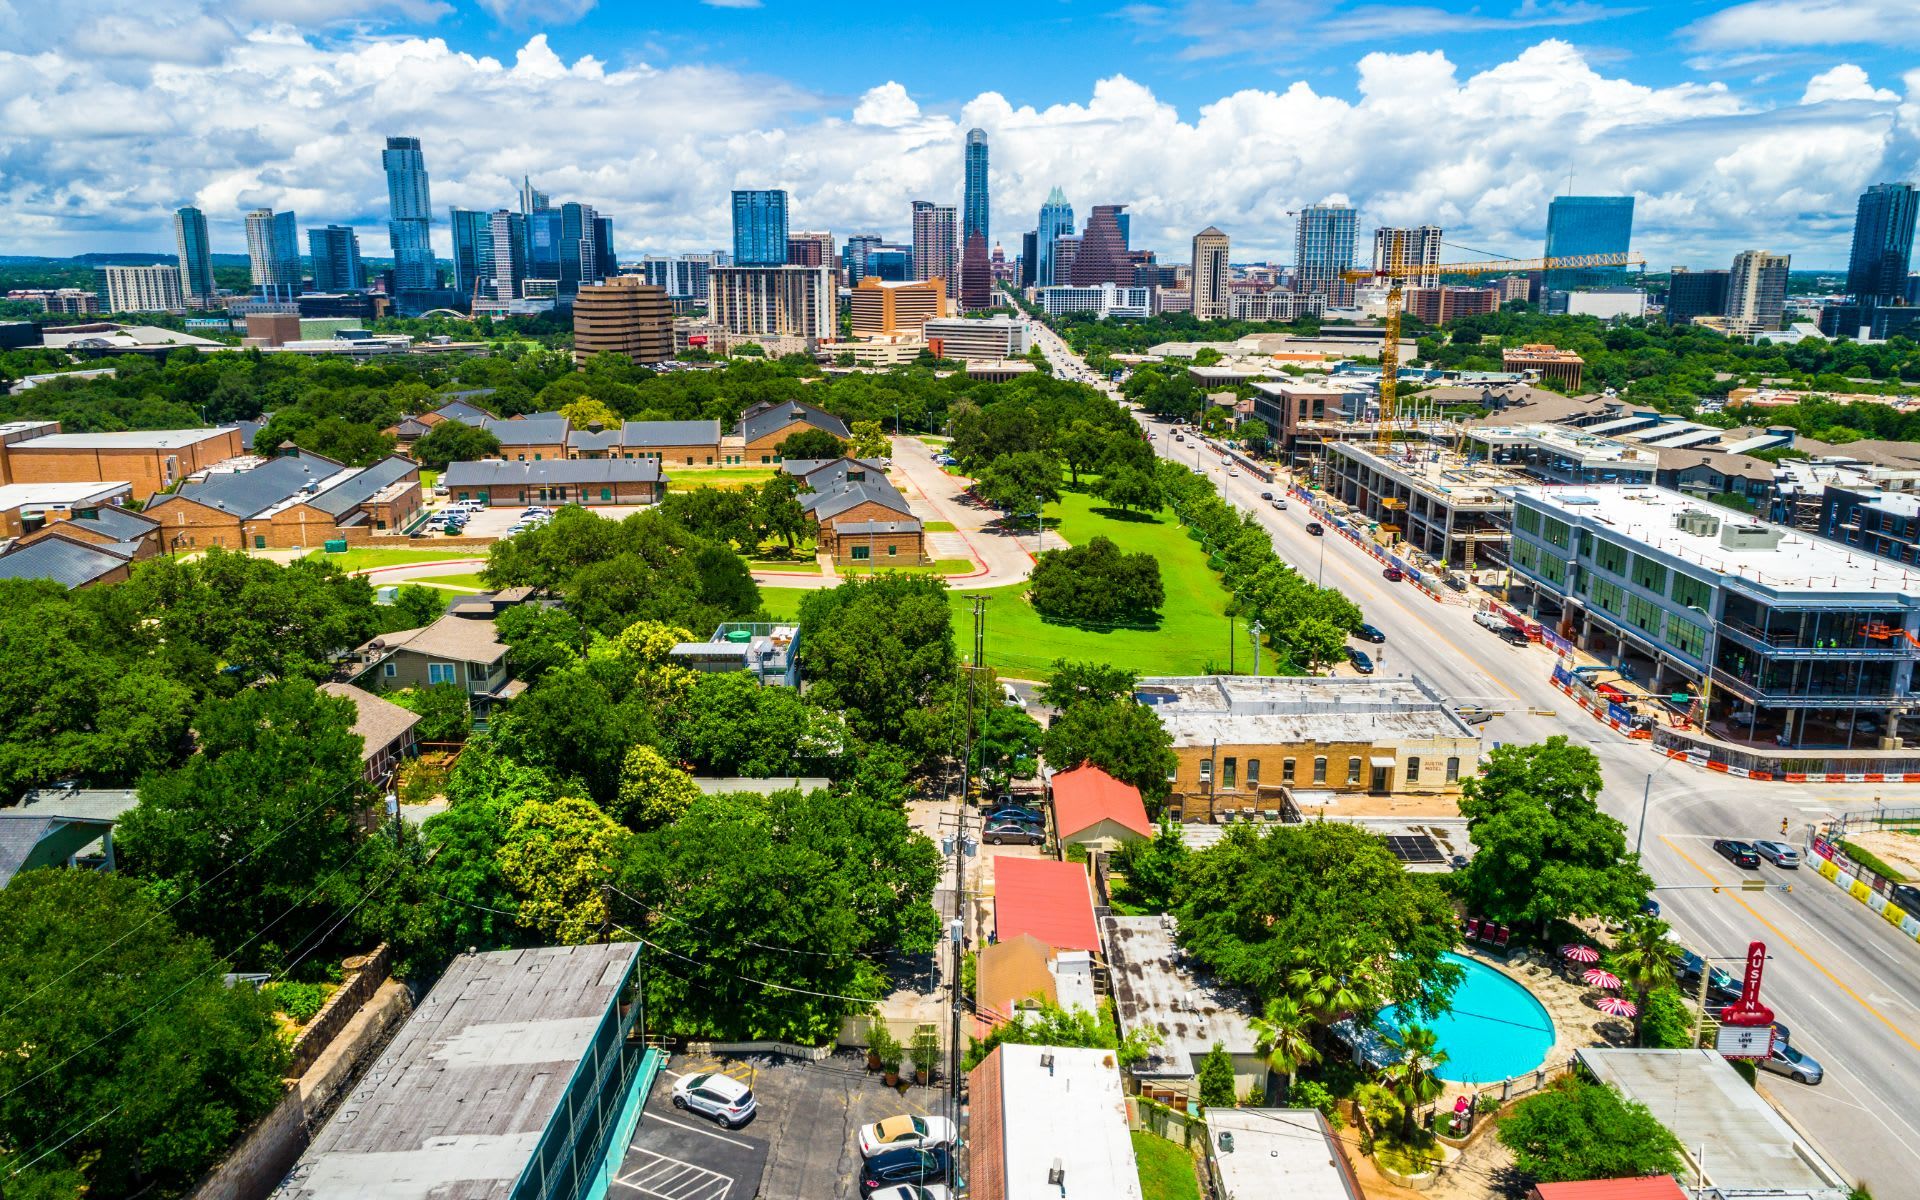
East Austin 78702 | Sales | Median close | $/sq ft | Days | Close ÷ orig. list |
|---|---|---|---|---|---|
3+ bd, 1,500–2,500 sq ft · 2025 | 109 | $875,000 | $449.51 | 47 | 93.0% |
3+ bd, 1,500–2,500 sq ft · 2026 | 87 | $850,000 | $460.26 | 32 | 95.6% |
$1M+ · 2025 | 54 | $1,285,000 | $548.14 | 55.5 | 92.1% |
$1M+ · 2026 | 39 | $1,176,600 | $546.24 | 20 | 95.3% |
Built 2020+ · 2025 | 85 | $960,000 | $545.21 | 58 | 92.2% |
Built 2020+ · 2026 | 53 | $785,000 | $487.60 | 49 | 94.8% |
In the core 1,500–2,500 sq ft band, price per foot rose 2.4% and market time fell by a third. New construction is the soft spot: the median new build sold for less per foot this year and got smaller (2,178 to 1,820 sq ft), so buyers of new East Austin product have room to negotiate. More in my East Austin guide.
Johnny's Off Market Private Luxury Listings
Ask me what is quietly for sale in East Austin right now
Tell me your price range and must-haves and I'll send what matches. Call or text 512-797-0965.
Circle C Ranch and the surrounding Southwest Austin communities in 78739. This is the healthiest market in my dataset, and it is not close.
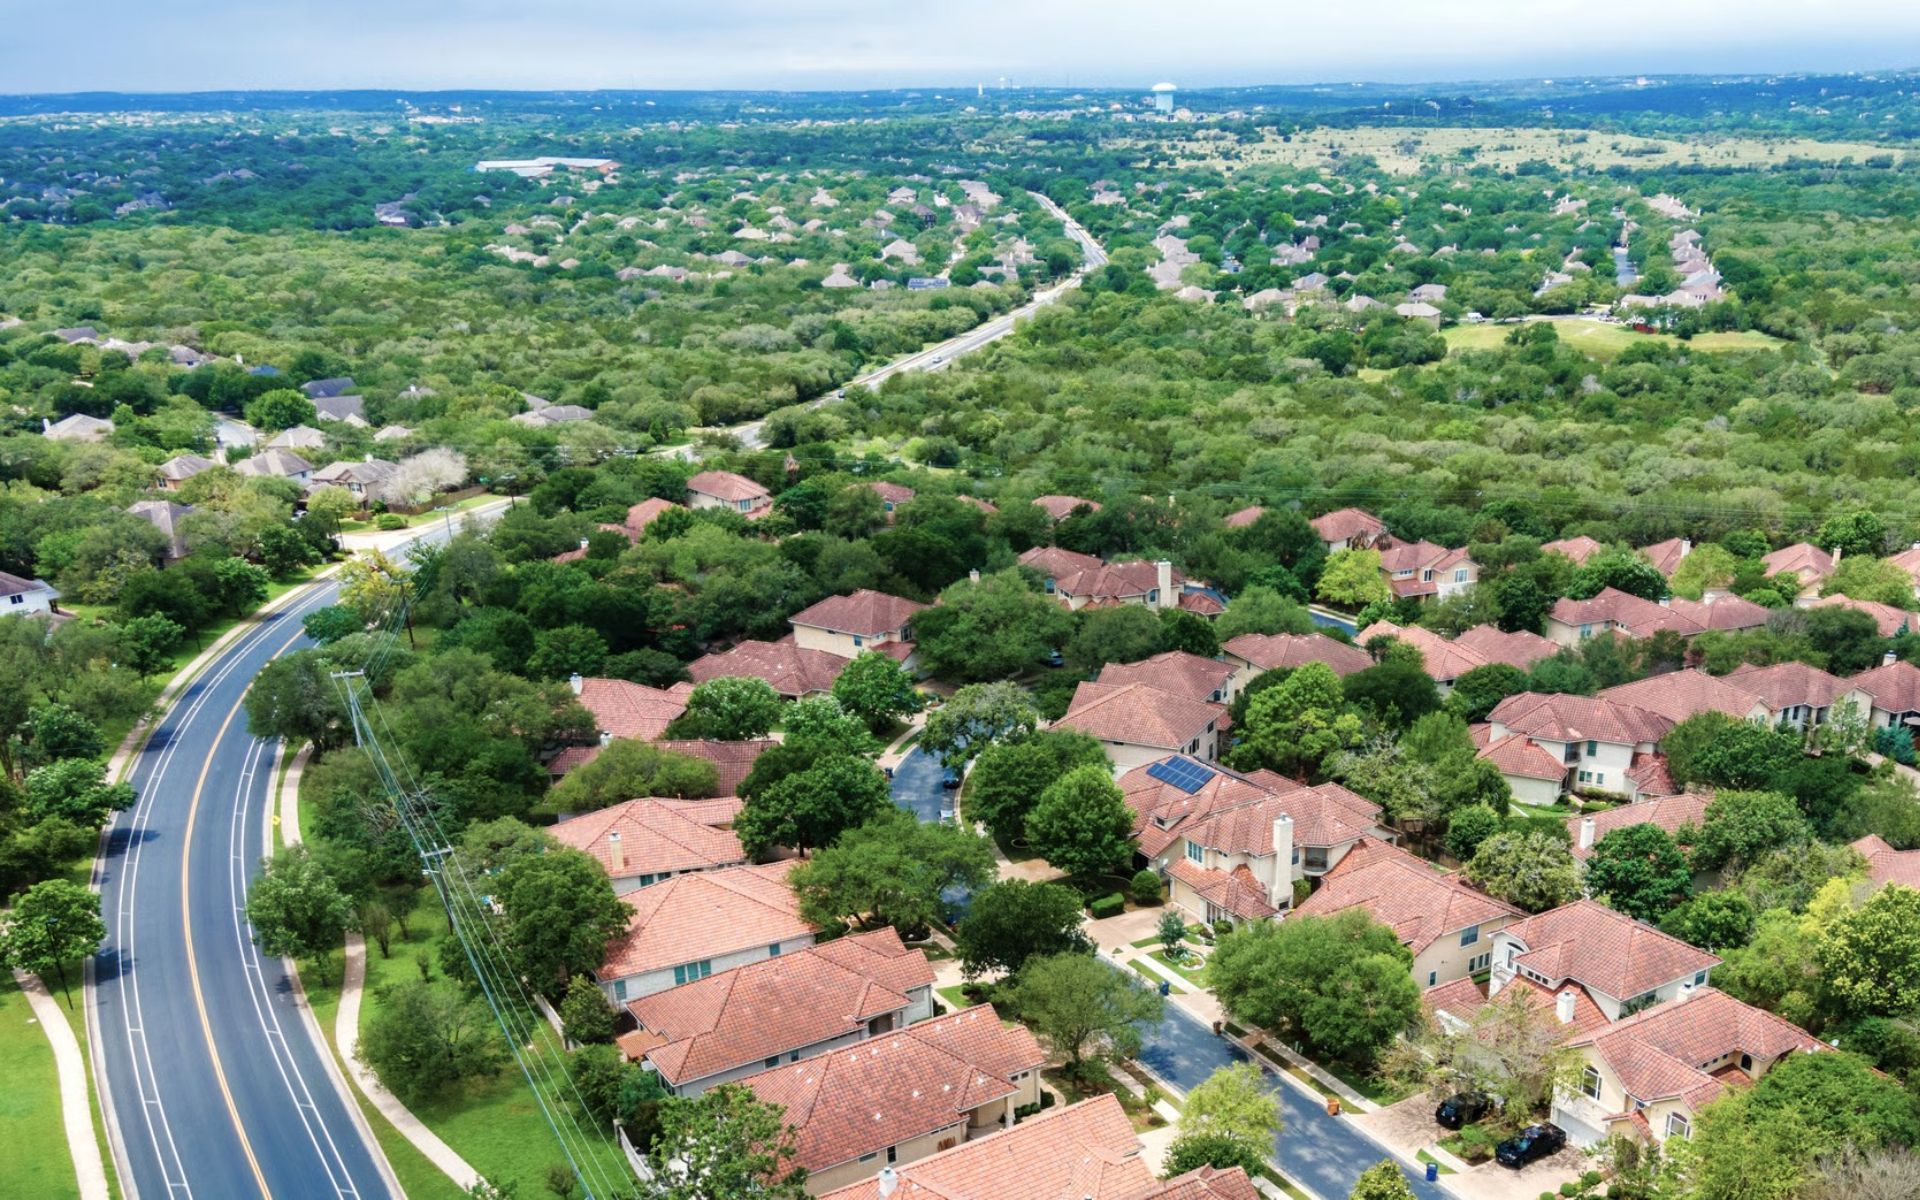
78739 matched homes | Sales | Median close | $/sq ft | Days | Close ÷ orig. list |
|---|---|---|---|---|---|
2,300–3,500 sq ft · 2025 | 120 | $795,000 | $282.59 | 20.5 | 97.5% |
2,300–3,500 sq ft · 2026 | 127 | $820,000 | $291.68 | 15.5 | 98.5% |
3,500–5,500 sq ft · 2025 | 42 | $1,092,500 | $294.47 | 16 | 94.4% |
3,500–5,500 sq ft · 2026 | 49 | $1,050,000 | $273.57 | 11 | 98.0% |
Both size bands have already beaten their full-year 2025 sale counts in nine months: 127 against 120, and 49 against 42. That is a real increase in pace, not a calendar quirk. Homes are selling in two to three weeks at 98% of the original asking price.
Inside the area, the neighborhood-level numbers tell the same story:
Circle C itself is essentially built out: only 4 homes built in 2020 or later sold in 2025, and 5 in 2026. New-construction buyers in this corridor are shopping the surrounding communities. The full breakdown is in my Circle C Ranch guide.
Barton Creek prices per foot rose, and the top end sold fast. These are single-family closings in subdivisions named Barton Creek in ZIP 78735.
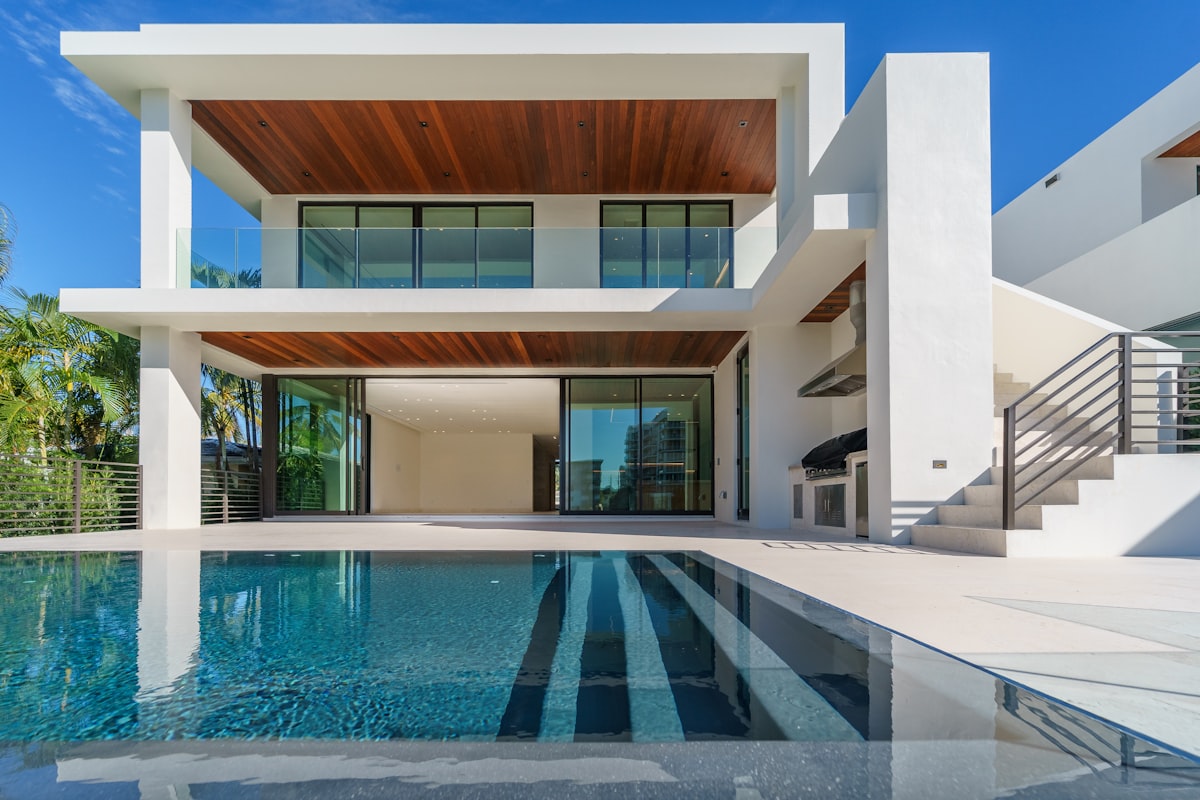
Barton Creek (78735) | Sales | Median close | $/sq ft | Days | Close ÷ orig. list |
|---|---|---|---|---|---|
3,500–5,500 sq ft · 2025 | 27 | $2,175,000 | $505.69 | 38 | 92.3% |
3,500–5,500 sq ft · 2026 | 11 | $2,800,000 | $579.71 | 69 | 89.4% |
5,500+ sq ft · 2025 | 7 | $3,500,000 | $601.46 | 135 | 83.3% |
5,500+ sq ft · 2026 | 5 | $4,725,000 | $685.58 | 19 | 96.0% |
In the 3,500–5,500 sq ft band, price per foot rose 14.6%, but those homes took longer to sell (38 days to 69). The 5,500+ band is only 7 and 5 sales, so treat it as a direction: this year's larger homes sold in a median 19 days at 96% of original list. See my Barton Creek guide.
Johnny's Off Market Private Luxury Listings
11 off-market pocket listings in Barton Creek right now
As of Sept 23, 2026. Tell me your price range and must-haves and I'll send what matches. Call or text 512-797-0965.
Prices per foot are up, but only the correctly priced homes are moving. Single-family waterfront closings in 78703, 78730, 78733 and 78746:
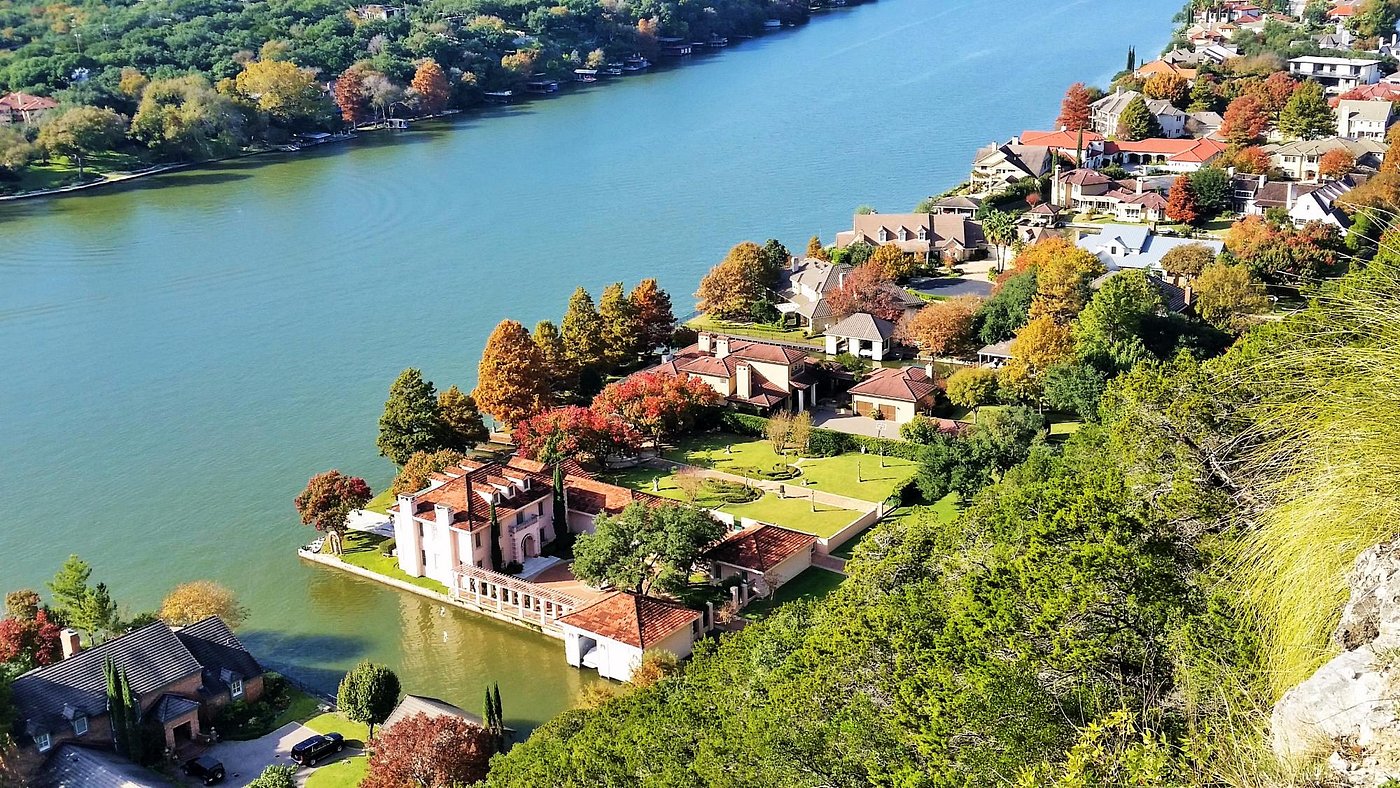
Lake Austin waterfront | 2025 | 2026 YTD |
|---|---|---|
Closed sales | 19 | 9 |
Median close | $4,365,000 | $5,050,000 |
Median $/sq ft | $1,039.27 | $1,173.03 |
Median size | 2,790 sq ft | 3,724 sq ft |
Median days on market | 121 | 273 |
Ignore the median price jump. The typical home that sold was a third bigger. Price per foot, up 12.9%, is the fair read, and nine sales is a thin sample. The headline I trust is market time: 121 days to 273.
The individual 2026 sales show why. 6901 Greenshores Dr came to market at $5,750,000 and closed at $5,965,000 in 5 days. 2305 Manana St came to market at $4,950,000 and closed at $4,915,000 in 19 days. Meanwhile 2917 Westlake Cv came to market at $7,600,000 and closed at $5,800,000 after 326 days. Same lake, same year. The difference was the starting price. The City of Austin also canceled the fall 2026 Lake Austin drawdown. I cover what that means for dock work and buyers in this post, and the lake itself in my Lake Austin guide.
Johnny's Off Market Private Luxury Listings
17 off-market waterfront pocket listings on Lake Austin right now
As of Sept 23, 2026. Tell me your price range and must-haves and I'll send what matches. Call or text 512-797-0965.
Yes, but the discount is shrinking. Lake Travis waterfront buyers still have more choice than anywhere else in this report, yet matched homes are selling faster and closer to asking than they did in 2025.

Lake Travis waterfront, matched homes* | 2025 | 2026 |
|---|---|---|
Sales | 44 | 36 |
Median close | $1,124,500 | $1,225,000 |
Median $/sq ft | $361.60 | $375.36 |
Median days on market | 91.5 | 67.5 |
Close ÷ original list | 82.6% | 88.7% |
*Single-family homes with the MLS waterfront flag in ZIPs 78734, 78738, 78669, 78645 and 78641, 3+ bedrooms, 2+ full baths, 2,500–4,000 sq ft. 2026 is Jan 1–Sept 27. 78732 is excluded because it also fronts Lake Austin.
Price per foot rose 3.8%, market time fell from 91.5 days to 67.5, and sellers gave up far less off their original price. Larger waterfront homes (4,000+ sq ft) rose from $432.11 to $469.34 per foot on 25 and 29 sales. Across all sizes, 103 Lake Travis waterfront homes closed in the first nine months of 2026, already more than the 98 in all of 2025.
Inventory is still the buyer's friend. On Sept 27 there were 170 active single-family waterfront listings in those ZIPs, at a median asking price of $1,475,000. At this year's sales pace, that is roughly 15 months of supply. Anything over six months favors buyers.
On Sept 27, 2026, Lake Travis was about 674.9 feet and 89.7% full, roughly 6 feet below its 681-foot full pool (Texas Water Development Board). That is down from 96.6% a month ago and up from 85.0% a year ago. At this level most coves have usable water, but dock depth still varies lot by lot. I check the dock, the cove and the lake-level history before any client writes an offer. More in my Lake Travis guide.
Johnny's Off Market Private Luxury Listings
15 off-market waterfront pocket listings on Lake Travis right now
As of Sept 23, 2026. Tell me your price range and must-haves and I'll send what matches. Call or text 512-797-0965.
Rough Hollow is one of the clearest turnarounds in this report: same prices, much faster sales. These are single-family closings in Rough Hollow subdivisions in ZIPs 78734 and 78738.
Rough Hollow matched homes | Sales | Median close | $/sq ft | Days | Close ÷ orig. list |
|---|---|---|---|---|---|
3,000–4,500 sq ft · 2025 | 34 | $915,000 | $262.61 | 71.5 | 92.0% |
3,000–4,500 sq ft · 2026 | 34 | $970,000 | $264.75 | 28 | 96.8% |
4,500+ sq ft · 2025 | 22 | $1,600,000 | $328.46 | 113 | 89.7% |
4,500+ sq ft · 2026 | 13 | $1,740,000 | $331.03 | 115 | 88.2% |
In the core 3,000–4,500 sq ft band, Rough Hollow matched its entire 2025 sale count in nine months (34 and 34). Price per foot was flat, but market time dropped from 71.5 days to 28, and sellers kept 96.8% of their original price. The largest homes are a different story: 4,500+ sq ft homes still took about 115 days at 88% of original list. Across all sizes, 69 homes closed in 2026 at a median of $895,000 and $291.54 per foot. More in my Rough Hollow guide and Lakeway guide.
Johnny's Off Market Private Luxury Listings
14 off-market pocket listings in Lakeway right now
As of Sept 23, 2026. Tell me your price range and must-haves and I'll send what matches. Call or text 512-797-0965.
Your list price now decides your result more than the market does. In every cohort above, correctly priced homes sold quickly at or near their original ask, and overpriced homes sat and then sold for much less. Three practical rules for Q4:
I also market select homes quietly through Johnny's Off Market Private Luxury Listings when privacy matters more than exposure.
Your leverage depends on the segment. In Circle C, Meridian and 78746 at mid-size price points, expect to compete: homes are going in days at 98%+ of ask. In large central-Austin homes, Lake Austin listings that have sat, and much of Lake Travis, you have room to negotiate. I regularly negotiate 5–10%+ under asking for buyers when the data supports it, and this quarter's data supports it in more places than it did a year ago. My free 2026 Austin Buyer's Playbook walks through the process.
Yes, both. Every neighborhood guide on my site has a live MLS search of the homes for sale in that area right now. Johnny's Off Market Private Luxury Listings cover the homes that never reach the MLS.
Many of my buyers find their luxury home off market, before it is ever listed. Some of the most coveted homes and waterfront properties in Austin only ever sell as pocket listings. Through Johnny's Off Market Private Luxury Listings and a 20-year network of agents across every brokerage, I have access to many off-market homes and waterfront properties on Lake Austin and Lake Travis. If you are searching for your dream home, tell me what you want and I'll show you what is quietly available: call or text 512-797-0965.
Area | Live MLS search | Off-market pocket listings (Sept 23) |
|---|---|---|
On the guide | 21 | |
On the guide | 17 waterfront, on the lake | |
On the guide | 16 | |
170 waterfront listed (Sept 27) | 15 waterfront, on the lake | |
On the guide | 14 in Lakeway | |
On the guide | 11 | |
On the guide | 8 | |
On the guide | Ask me | |
On the guide | Ask me |
Off-market counts are the homes I know are quietly available and change weekly. Text PRIVATE to 512-797-0965 with your area and price range, and I'll send you what matches.
All figures are closed single-family sales from Unlock MLS (ACTRIS), pulled Sept 22–27, 2026. Year-over-year comparisons use matched cohorts (3+ bedrooms, 2+ baths, same square-footage band and ZIP) wherever noted. The Westlake quarterly figures and supply numbers are ZIP-wide. Lake Austin waterfront uses the MLS waterfront flag in 78703, 78730, 78733 and 78746. Lake Travis waterfront uses the same flag in 78734, 78738, 78669, 78645 and 78641. 78732 is excluded from both because it fronts both lakes. Barton Hills, Zilker, Barton Creek and Rough Hollow use MLS subdivision names constrained by ZIP. East Austin is all single-family closings in ZIP 78702. Lake level is from the Texas Water Development Board on Sept 27, 2026. 2026 figures are year to date, so sale counts cover about nine months against twelve and are not a trend on their own. Medians, price per foot, days on market and list-to-close ratios compare cleanly.
Both, depending on the segment. Mid-size luxury homes in top locations are up modestly in price and selling much faster: in 78704, 2,300–3,500 sq ft homes rose 7.2% with market time down from 52 to 34 days. The largest homes are down. In 78704, 3,500–5,500 sq ft homes fell about 21% per square foot.
The Q3 2026 median was 30 days on market through Sept 22, down from 61 days in Q3 2025. Sellers kept 93% of their original asking price against 88% a year earlier.
Circle C Ranch and 78739. Matched 2,300–3,500 sq ft homes sold in a median 15.5 days at 98.5% of original list in 2026, and 3,500–5,500 sq ft homes in 11 days at 98.0%.
$5,050,000 for 2026 closings to date (9 sales), at $1,173 per square foot. In 2025 it was $4,365,000 on 19 sales at $1,039 per square foot. Median market time rose from 121 to 273 days.
Much cheaper per foot. Over the 12 months through Sept 22, Lake Travis waterfront closed at a median of $406 per square foot on 124 sales. Over two years, Lake Austin waterfront has traded at roughly three times that.
Mostly a buyer's market. Lakeway 78734 had 7.3 months of supply and Spicewood 78669 had 16.8 on Sept 22. Over six months generally favors buyers.
On Sept 27, 2026, Lake Travis was 89.7% full at about 674.9 feet, roughly 6 feet below its 681-foot full pool, according to the Texas Water Development Board. It was 96.6% full a month earlier and 85.0% a year earlier.
Matched waterfront homes (3+ bedrooms, 2,500–4,000 sq ft) sold in a median 67.5 days in 2026, down from 91.5 in 2025, at 88.7% of original list price.
Yes. Rough Hollow homes of 3,000–4,500 sq ft sold in a median 28 days in 2026, down from 71.5, at 96.8% of original list, with price per foot essentially flat.
In ZIP 78702, homes over $1 million sold in a median 20 days in 2026, down from 55.5 days in 2025, at 95.3% of original list price.
Not if it is priced correctly. Well-priced homes in every cohort in this report sold quickly and near asking. Waiting only helps if something specific about your home or your timing will change.
It depends on the segment. In Circle C and mid-size 78746 homes, sellers are getting 93–99% of original list. In large central-Austin homes and on Lake Travis, the gap is wider, and homes that have sat 90+ days usually have the most room.
Johnny Ronca, Luxury Associate Broker with SERHANT., is widely regarded as a top Austin luxury and waterfront realtor, with 20+ years in the market, 300+ closings, $250M+ in sales and 100+ five-star reviews. He publishes matched, MLS-verified market data like this report every quarter.
Closed single-family sales from Unlock MLS (ACTRIS), the Austin-area MLS, pulled Sept 22–27, 2026. Year-over-year comparisons use matched homes wherever noted.
Want this analysis for your home or your search?
I'll pull matched closed sales for your exact neighborhood, size and price point, and show you the off-market and waterfront homes that never reach the MLS. Tell me about your dream home and I'll help you find it.
Book a 15-minute call · or text REPORT to 512-797-0965
Johnny Ronca
Luxury Associate Broker, SERHANT.
20+ years · 300+ closings · $250M+ in sales · 100+ 5-star reviews
512-797-0965 · [email protected] · johnnyronca.com
Your insider guide to buying smart in Austin's market. 11 chapters covering undervalued neighborhoods, 2/1 buydown strategies, off-market deals, school rankings, and expert tactics from a Top 1% agent with 300+ closed transactions.
Stay up to date on the latest real estate trends.
Real Estate
Matched MLS sold data for Westlake 78746, 78704, Circle C, Lake Austin and Lake Travis
The City called off the October-November drawdown on September 24 with no new date. Here is what changed, and what 34 closed waterfront sales say about buying on Lake … Read more
I am committed to guiding you every step of the way—whether you're buying a home, selling a property, or securing a mortgage. Whatever your needs, I've got you covered.
801 BARTON SPRINGS RD AUSTIN, TX 78704