Westlake Market Report 2026: What Homes in 78746 Actually Sold For
September 22, 2026
September 22, 2026
The 15-Second Answer
Westlake homes in 78746 closed at a $2,050,000 median and $582 per square foot over the 12 months ending September 22, 2026 — up 4.6 percent from the prior year, with days on market cut from 58 to 34. 270 homes closed. The most expensive pocket was Las Lomas at a $5,164,500 median; the most accessible were Lost Creek and Beecave Woods at $1,200,000. Here is the whole picture, neighborhood by neighborhood, from closed MLS sales.
I am Johnny Ronca, a SERHANT. Luxury Associate Broker. I have sold Austin real estate for more than 20 years, closed 300+ transactions, and I have watched this particular ZIP code go through three different markets. This report is built entirely from closed Unlock MLS sales pulled on September 22, 2026 — not estimates, not list prices, not a portal index.
If you own in West Lake Hills, Rollingwood or anywhere else in 78746, the number that matters is not the metro headline. It is what homes like yours, in your pocket, in your size band, actually closed for. That is what this is.
$2,050,000 over the trailing 12 months, on 270 closed single-family sales, at a $582 per-square-foot median.
78746 metric | Trailing 12 months | Prior 12 months | Change |
|---|---|---|---|
Closed sales | 270 | 234 | +15% |
Median close price | $2,050,000 | $1,960,000 | +4.6% |
Average close price | $2,521,204 | $2,439,408 | +3.4% |
Median price per sq ft | $582 | $561 | +3.7% |
Median days on market | 34 | 58 | −24 days |
Median % of original list | 93% | 90% | +3 pts |
Median size | 3,533 sq ft | 3,508 sq ft | — |
Closed single-family sales in ZIP 78746. Trailing 12 months = 9/23/2025–9/22/2026. Source: Unlock MLS, pulled September 22, 2026.
Volume up 15 percent, price up 4.6 percent, market time down 24 days, and sellers keeping three more points of their original asking price. Those four numbers together describe a market that got healthier, not hotter. Nothing here looks like 2021, and nothing here looks like the 2023 stall either.
78746 has run between $1,850,000 and $2,482,000 in quarterly medians since late 2024, with market time collapsing in 2026.
Quarter | Closed sales | Median close | Median $/sq ft | Median DOM | % of original list |
|---|---|---|---|---|---|
2024 Q4 | 47 | $1,850,000 | $570 | 65 | 88% |
2025 Q1 | 39 | $2,150,000 | $589 | 96 | 90% |
2025 Q2 | 80 | $2,050,000 | $520 | 53 | 91% |
2025 Q3 | 68 | $1,872,500 | $561 | 61 | 88% |
2025 Q4 | 64 | $1,890,000 | $577 | 50 | 89% |
2026 Q1 | 53 | $2,482,000 | $585 | 111 | 92% |
2026 Q2 | 83 | $2,100,000 | $605 | 29 | 94% |
2026 Q3 (through 9/22) | 63 | $1,950,000 | $573 | 30 | 93% |
Quarterly closed single-family sales, ZIP 78746. Source: Unlock MLS.
Two patterns worth naming. First, the quarterly median bounces around a lot in a ZIP that only closes 40 to 80 homes a quarter — a handful of $6M sales moves it. Price per square foot is the steadier read, and it has climbed from $570 to the $573–$605 range. Second, days on market fell off a cliff in the second quarter of 2026, from 111 to 29, and has stayed there. That is the single most important thing in this table.
Median closed prices inside 78746 and 78733 range from $5,164,500 in Las Lomas down to $720,000 in Austin Lake Estates.
Neighborhood | ZIP | Sales (24 mo) | Median close | Median $/sq ft | Median DOM |
|---|---|---|---|---|---|
Las Lomas | 78746 | 4 | $5,164,500 | $825 | 110 |
Timberline Terrace | 78746 | 8 | $4,787,500 | $951 | 67 |
78733 | 15 | $3,425,000 | $591 | 26 | |
78746 | 13 | $3,417,838 | $858 | 92 | |
Bluffington | 78746 | 5 | $3,265,000 | $799 | 94 |
78746 | 15 | $2,850,000 | $572 | 84 | |
78746 | 5 | $2,800,000 | $770 | 43 | |
Treemont | 78746 | 6 | $2,656,250 | $641 | 29 |
Westview on Lake Austin | 78746 | 12 | $2,630,000 | $517 | 75 |
Bull Mountain | 78746 | 9 | $2,600,000 | $607 | 51 |
Rob Roy on the Creek | 78746 | 7 | $2,482,000 | $519 | 38 |
Woodhaven | 78746 | 15 | $2,475,000 | $690 | 82 |
78746 | 17 | $2,200,000 | $570 | 112 | |
Davenport West | 78746 | 7 | $2,100,000 | $519 | 33 |
Rob Roy on Lake Austin | 78733 | 10 | $2,006,500 | $440 | 68 |
78746 | 40 | $1,972,500 | $509 | 71 | |
Stonehedge Estates | 78746 | 8 | $1,906,000 | $674 | 48 |
Westlake Park | 78746 | 6 | $1,812,500 | $687 | 95 |
Countryside | 78746 | 13 | $1,660,000 | $671 | 19 |
78746 | 6 | $1,592,500 | $546 | 73 | |
Ridgewood Village | 78746 | 6 | $1,542,500 | $628 | 68 |
Villas at Treemont | 78746 | 6 | $1,377,500 | $409 | 38 |
Woods of Westlake | 78746 | 6 | $1,375,000 | $514 | 22 |
Barton Creek West | 78733 | 17 | $1,371,000 | $406 | 18 |
Hills of Lost Creek | 78746 | 14 | $1,332,500 | $521 | 12 |
78733 | 21 | $1,300,000 | $378 | 14 | |
78746 | 29 | $1,200,000 | $517 | 39 | |
Beecave Woods | 78746 | 25 | $1,200,000 | $531 | 24 |
78733 | 36 | $1,027,500 | $395 | 31 | |
Austin Lake Estates | 78733 | 31 | $720,000 | $435 | 33 |
Closed single-family sales by MLS subdivision, 24 months ending September 22, 2026, minimum four sales. Small samples are directional. Source: Unlock MLS.
A few honest caveats on that table. Las Lomas at four sales and Rollingwood at five are small samples — the medians are real closings but they are not a stable index. Davenport Ranch (40 sales), Austin Lake Hills (36), Austin Lake Estates (31), Lost Creek (29) and Beecave Woods (25) are the pockets with enough volume that you can actually price against them with confidence.
The most useful line for buyers: the same Eanes ISD district that costs $5.1M in Las Lomas costs $1,027,500 in Austin Lake Hills and $720,000 in Austin Lake Estates, both in 78733. If the district is the point, the entry price is dramatically lower than the Westlake headline suggests.
In 78746 over the last 12 months, the median ran $1,040,000 under 2,000 square feet, $1,393,139 from 2,000 to 3,000, $1,950,000 from 3,000 to 4,000, $3,065,000 from 4,000 to 6,000 and $4,750,000 above 6,000.
Size band | Closed sales | Median close | Median $/sq ft | Median DOM | % of original list |
|---|---|---|---|---|---|
Under 2,000 sq ft | 20 | $1,040,000 | $582 | 26 | 92% |
2,000 – 2,999 | 79 | $1,393,139 | $549 | 32 | 94% |
3,000 – 3,999 | 66 | $1,950,000 | $574 | 36 | 92% |
4,000 – 5,999 | 76 | $3,065,000 | $621 | 92 | 90% |
6,000+ | 29 | $4,750,000 | $640 | 87 | 92% |
Closed single-family sales in 78746, trailing 12 months. Source: Unlock MLS.
This is the table I wish every Westlake seller saw before pricing. Look at days on market: homes under 4,000 square feet sold in 26 to 36 days. Homes over 4,000 took 87 to 92 days, nearly three times as long, and closed further below original list. The buyer pool thins fast above 4,000 feet in this ZIP, and pricing has to respect that.
For buyers the same table reads as opportunity. The 4,000-to-6,000 band is where negotiating room lives in Westlake — 76 sales, 92 median days on market and a median 90 percent of original list, the weakest ratio of any size band.
Price band | Closed sales | Median close | Median $/sq ft | Median DOM | % of original list |
|---|---|---|---|---|---|
Under $1M | 12 | $837,500 | $391 | 51 | 91% |
$1M – $1.5M | 73 | $1,260,000 | $529 | 32 | 93% |
$1.5M – $2M | 45 | $1,750,000 | $555 | 32 | 94% |
$2M – $3M | 63 | $2,482,000 | $581 | 37 | 92% |
$3M – $5M | 57 | $3,675,000 | $743 | 98 | 89% |
$5M+ | 20 | $6,218,750 | $1,071 | 49 | 94% |
Closed single-family sales in 78746, trailing 12 months. Source: Unlock MLS.
The $3M to $5M band is the softest part of the Westlake market right now: 98 median days and 89 percent of original list. Above $5M it tightens again — those buyers are usually purchasing a specific irreplaceable property, often on Lake Austin, and the $1,071 median per foot reflects that.
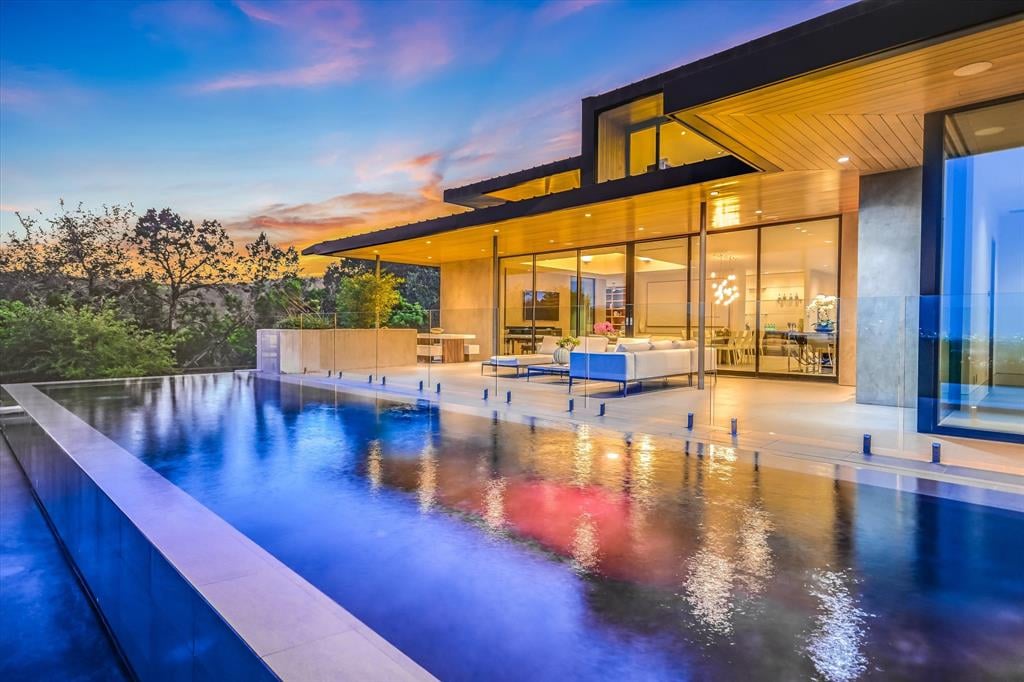
Pool homes in 78746 and 78733 closed at $594 per square foot against $513 for homes without one — roughly a 16 percent per-foot premium.
Closed sales | Median close | Median $/sq ft | Median size | Median DOM | |
|---|---|---|---|---|---|
With a pool | 187 | $2,635,000 | $594 | 4,346 sq ft | 35 |
No pool | 169 | $1,340,000 | $513 | 2,660 sq ft | 27 |
Closed single-family sales in 78746 and 78733, trailing 12 months. Source: Unlock MLS.
Do not read the headline price gap as the value of a pool. Pool homes here are also far larger — a 4,346-square-foot median against 2,660 — so most of that $1.3M difference is house, not water. The per-foot comparison is the honest one, and it says the pool market carries about a 16 percent premium per foot in this part of town. Homes without a pool also sell slightly faster.
99 active listings in 78746 as of September 22, 2026, which is about 4.4 months of supply — a balanced market.
Active 78746 listings run from $1,050,000 to $19,000,000, with a $2,899,950 median list price, a median size of 3,992 square feet and a median 57 days on market. Compare that median list price to the $2,050,000 median close and you can see the gap sellers are trying to bridge: the listings skew larger and more expensive than what is actually trading.
Next door in 78733 there are 31 active listings against 86 trailing-twelve-month sales, also about 4.3 months. 78735 is tighter at 3.2 months. All three are healthier than Lakeway at 7.3 months and Spicewood at 16.8.
If you are selling in Westlake this fall
Johnny's Off Market Private Luxury Listings
A real share of Austin luxury trades quietly. I work three private venues for high-end pocket listings, plus a list of agents I can call or text directly to ask what is coming before it hits the MLS. If you want to know what is available off market in a specific pocket, ask me and I will make the calls.
Over the 12 months ending September 22, 2026, the average closed price in 78746 was $2,521,204 and the median was $2,050,000, across 270 closed single-family sales. Median is the more useful number here because a handful of $6M-plus sales pull the average up.
Up modestly. The 78746 median rose 4.6 percent year over year, from $1,960,000 to $2,050,000, and price per square foot rose from $561 to $582. The bigger change is speed: median days on market fell from 58 to 34.
On closed sales over the last 24 months, Austin Lake Estates in 78733 at a $720,000 median, followed by Austin Lake Hills at $1,027,500. Inside 78746, Lost Creek and Beecave Woods both ran a $1,200,000 median.
Las Lomas at a $5,164,500 median over 24 months, though on only four sales. Timberline Terrace at $4,787,500 across eight sales is the more statistically meaningful top of the market, and it carries the highest per-foot figure in the area at $951.
The 78746 median was 34 days over the trailing 12 months, down from 58 the year before. It varies a lot by size: 26 to 36 days under 4,000 square feet, and 87 to 92 days above 4,000.
$582 per square foot was the 78746 median over the trailing 12 months. By band it ran $549 in the 2,000-to-3,000 range, $621 from 4,000 to 6,000, and $1,071 for homes above $5 million.
Balanced, at about 4.4 months of supply. Within that, homes under $2M and under 4,000 square feet behave like a seller’s market, and the $3M to $5M band behaves like a buyer’s market at 98 median days and 89 percent of original list.
Mostly, but not exactly. Most of 78746 is Eanes ISD, and Eanes also extends into 78733 and a sliver of 78738. Parts of Barton Creek in 78735 are Austin ISD. Always confirm assigned campuses for a specific address with the district.
Three things stacked on top of each other: Eanes ISD, which holds an A rating at 94 out of 100 from the state; a ten-to-twenty-minute drive to downtown; and very limited supply, since most of the area is built out on hilly, hard-to-develop terrain with some of the only Lake Austin frontage inside the city.
Yes, and properly — with the closed sales in your subdivision and size band, adjusted for your lot, view, condition and finish level. It takes me about a day to put together and there is no obligation attached to it.
Want the closed comps for your Westlake street?
I will pull every closed sale in your subdivision for the last 12 months, filtered to homes like yours, and send you what they mean for your value today — plus what is quietly available off market if you are buying.
Or text WESTLAKE to (512) 797-0965 and I will send the current numbers for your street.
Johnny Ronca
SERHANT. Luxury Associate Broker · Serhant Texas, LLC
20+ years in Austin real estate · 300+ closed transactions · $250M+ in career sales
(512) 797-0965 · [email protected] · johnnyronca.com
Source: Unlock MLS (ACTRIS) closed-sale data, pulled September 22, 2026. Figures are medians for closed single-family sales unless stated otherwise. Neighborhood figures are grouped by MLS subdivision name and normalized across sections; pockets with fewer than about ten sales should be treated as directional rather than as a stable index. Market statistics are reported in aggregate and are not a substitute for a written valuation of a specific home.
Your insider guide to buying smart in Austin's market. 11 chapters covering undervalued neighborhoods, 2/1 buydown strategies, off-market deals, school rankings, and expert tactics from a Top 1% agent with 270+ closed transactions.
Stay up to date on the latest real estate trends.
I am committed to guiding you every step of the way—whether you're buying a home, selling a property, or securing a mortgage. Whatever your needs, I've got you covered.
7415 SOUTHWEST PKWY BLDG 2 STE 200 AUSTIN TX 78620