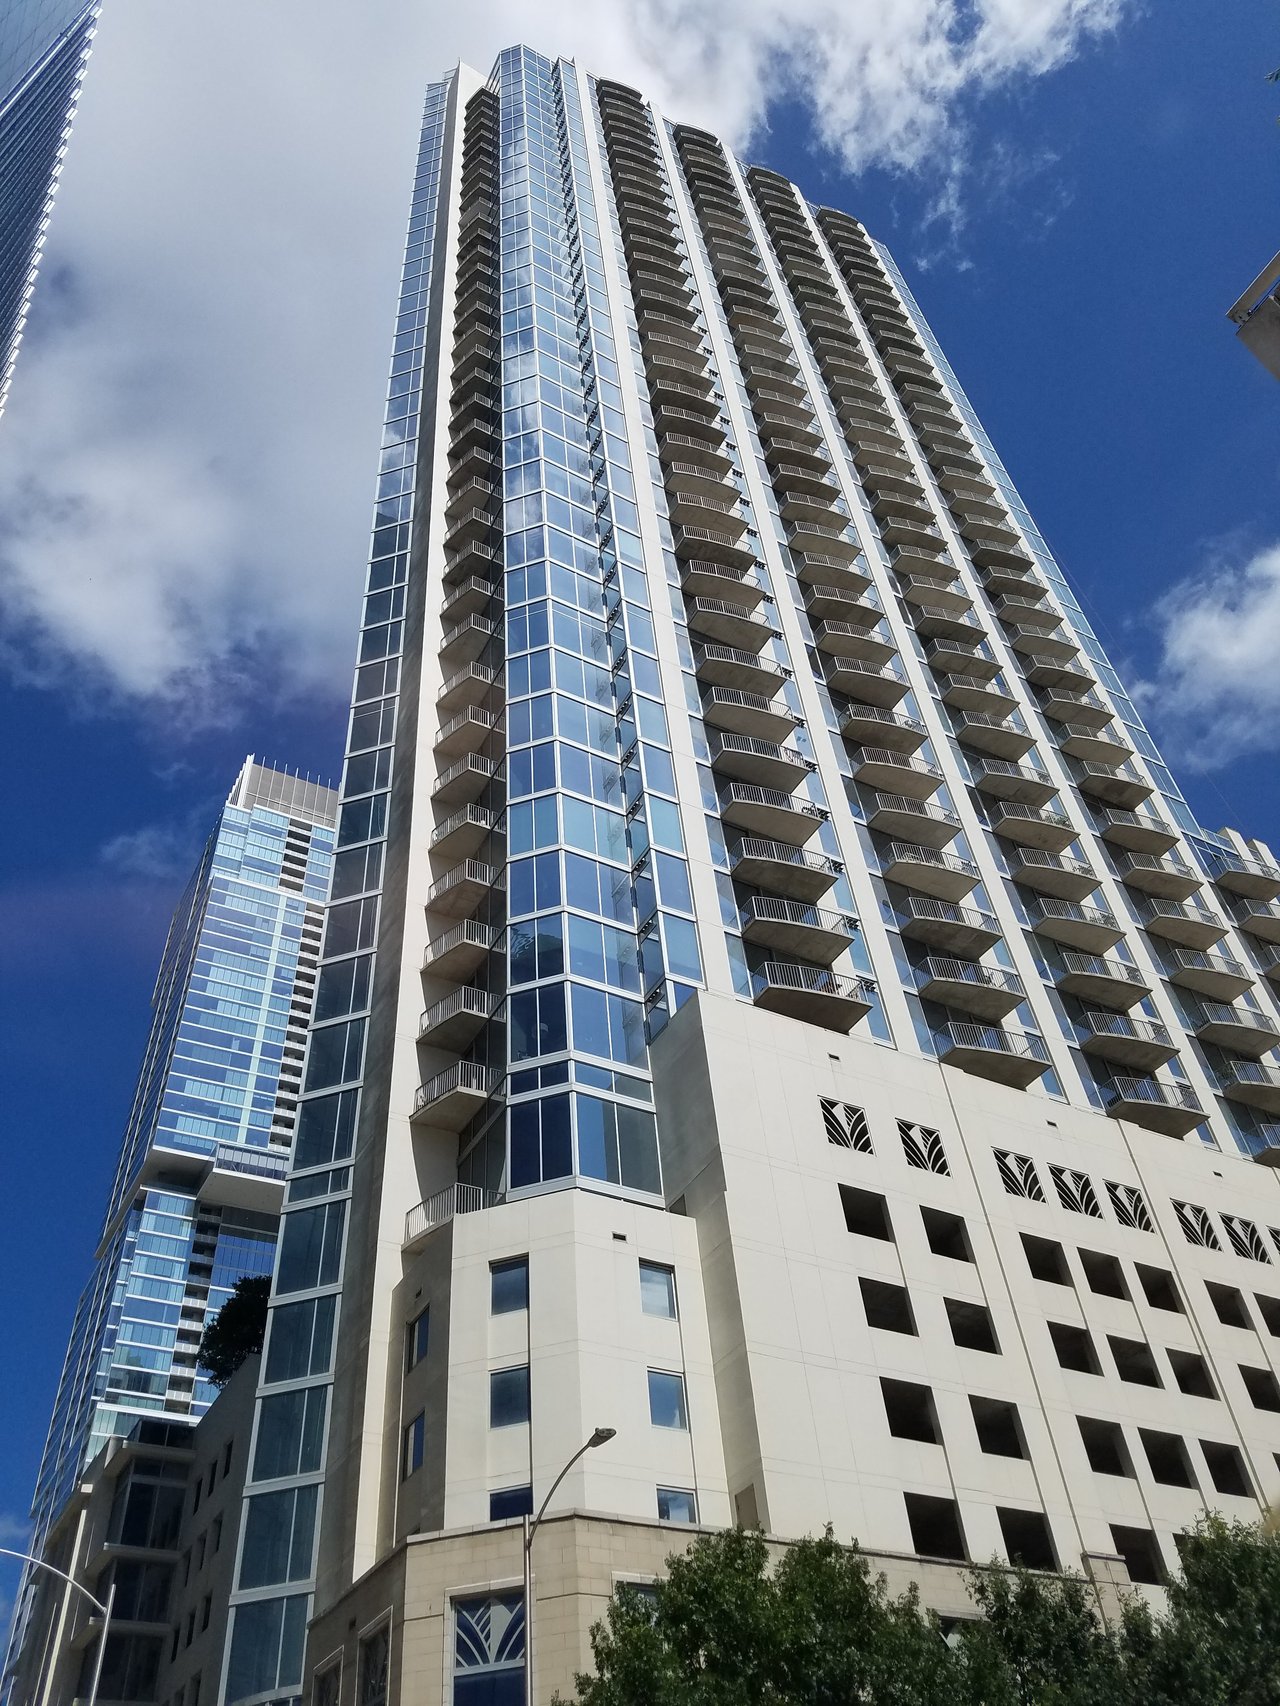
Downtown Austin Condo Market Report 2026: Prices by Building
September 22, 2026
September 22, 2026
The 15-Second Answer
Downtown Austin condos closed at a $640,625 median and $687 per square foot over the 12 months ending September 22, 2026 — volume up 15 percent year over year while the median price came down about 5 percent. 218 units closed in 78701. Building matters enormously: The Austonian closed at a $1,700,000 median and $1,057 per foot over two years, while 360 Condominiums closed at $525,000 and $624 per foot. Sellers are getting 96 percent of last list but only 92 percent of original list, which tells you where the negotiating room is.
I am Johnny Ronca, a SERHANT. Luxury Associate Broker in Austin. This report is built from closed condo sales in Unlock MLS, pulled September 22, 2026 — 407 closings in 78701 over 24 months, grouped by building. Not list prices, not developer marketing, not a portal index.
The downtown condo market is the hardest Austin submarket to read from the outside, because a single tower’s sales can swing the whole ZIP’s median. That is exactly why the building-level table below matters more than the headline number.
The 78701 median closed price was $640,625 over the trailing 12 months, at $687 per square foot, on a 1,177-square-foot median unit.
78701 condos | Trailing 12 months | Prior 12 months | Change |
|---|---|---|---|
Closed sales | 218 | 189 | +15% |
Median close price | $640,625 | $674,000 | −5.0% |
Average close price | $948,551 | $993,625 | −4.5% |
Median price per sq ft | $687 | $707 | −2.8% |
Median days on market | 69 | 83 | −14 days |
Median % of last list | 96% | 96% | — |
Median % of original list | 92% | 92% | — |
Median unit size | 1,177 sq ft | 1,164 sq ft | — |
Closed condominium sales in ZIP 78701. Source: Unlock MLS, pulled September 22, 2026.
More units selling, slightly lower prices, and two weeks less time on market. That is a market clearing inventory, which is healthy after several years of heavy high-rise delivery. The gap between 96 percent of last list and 92 percent of original list is the important one: the typical downtown seller cut the price once before finding a buyer.
Median closed prices range from about $505,000 at Milago to $1,700,000 at The Austonian, and per-foot prices from $488 to $1,057.
Building | Closed sales (24 mo) | Median close | Median $/sq ft | Median size | Median days on market |
|---|---|---|---|---|---|
23 | $1,700,000 | $1,057 | 1,918 sq ft | 71 | |
31 | $1,289,500 | $935 | 1,441 sq ft | 48 | |
10 | $1,055,000 | $865 | 1,154 sq ft | 127 | |
43 | $890,000 | $810 | 1,232 sq ft | 120 | |
21 | $575,000 | $815 | 740 sq ft | 130 | |
26 | $572,548 | $798 | 821 sq ft | 138 | |
52 | $525,000 | $624 | 842 sq ft | 74 | |
Milago | 21 | $505,000 | $488 | 1,164 sq ft | 154 |
All other 78701 buildings | 120 | $551,500 | $499 | 1,010 sq ft | 90 |
Closed condominium sales by building, 24 months ending September 22, 2026. Buildings with fewer than ten sales are directional. Source: Unlock MLS.
Read the size column next to the price column. Natiivo’s $575,000 median is a 740-square-foot unit at $815 a foot — that is a high per-foot price in a small package. Milago’s $505,000 is a 1,164-square-foot unit at $488 a foot. Two very different products at a similar headline price.
The Independent is the standout on speed: a 48-day median against 120 to 154 days at 44 East Ave, Natiivo, Seaholm and Milago. In this market, the towers with the strongest resale demand are clearing in about seven weeks and the rest are taking four to five months.
78701 is the most expensive condo ZIP per square foot at $687; 78705 near campus is the least at $356.
ZIP | Area | Sales (12 mo) | Median close | Median $/sq ft | Median size | Median DOM |
|---|---|---|---|---|---|---|
78701 | 218 | $640,625 | $687 | 1,177 sq ft | 69 | |
78703 | 69 | $725,000 | $510 | 1,468 sq ft | 49 | |
78702 | 72 | $521,825 | $429 | 1,184 sq ft | 47 | |
78704 | 210 | $457,500 | $403 | 1,101 sq ft | 71 | |
78705 | Campus / West Campus | 124 | $268,250 | $356 | 776 sq ft | 66 |
Closed condominium sales, trailing 12 months. Source: Unlock MLS.
78703 is the interesting line. It has the highest median close price of the five at $725,000, but a much lower per-foot price than downtown, because you are buying a larger unit in a low-rise building rather than a tower with a doorman. It also rose sharply year over year, from a $495,000 median to $725,000.
78705 went the other way: 162 closings the prior year, 124 this year, with the median falling from $299,000 to $268,250. That submarket is dominated by student-oriented product and behaves nothing like the rest of the condo market.
They are priced better than they were a year ago, and the volume recovery suggests a floor forming — but carrying costs decide this, not price.
Here is the honest version. The median downtown condo is 2.8 percent cheaper per square foot than a year ago and sells two weeks faster. Buyers are transacting again. That is the bull case.
The bear case lives in the monthly costs. Downtown HOA dues, Travis County property taxes and insurance together often run more than a mortgage payment on a comparable suburban house. Before you model appreciation, model the carry: dues per square foot, the tax bill at the new assessed value, and whether the building allows the rental strategy you have in mind — some towers, Natiivo among them, are built around short-term rental use, and most are not.
If you want the analysis on a specific building, I will pull its closed sales, its price trend over eight quarters, current dues and how long resales actually take there. That is a very different conversation from what a listing agent will tell you in the lobby.
On this data, the towers with the strongest resale position are The Independent and 360 Condominiums — not because of price level, but because of how fast and how close to asking they close.
The Independent closed at a 97 percent median of last list, 92 percent of original, in 48 median days. 360 Condominiums closed at 97 percent of last list, 95 percent of original, in 74 days across 52 sales — the highest transaction volume of any single building downtown, which makes it the easiest to value and the easiest to exit.
At the other end, Milago (154 median days), Seaholm (138) and Natiivo (130) took four to five months. Long market times are not a verdict on the buildings themselves; they usually mean sellers there started above what the last comparable sale supports.
What I tell downtown condo buyers
Johnny's Off Market Private Luxury Listings
Downtown has a quiet market too. Owners in the top towers frequently test the market privately before they list, especially in the $1M-plus tier. I work three private venues for high-end pocket listings and I can call agents in specific buildings directly to ask what is coming. If you want a particular line or floor, tell me and I will start asking.
The median closed price in 78701 was $640,625 over the 12 months ending September 22, 2026, and the average was $948,551, across 218 closed sales. The median works out to about $687 per square foot on a 1,177-square-foot unit.
Modestly. The 78701 median fell about 5 percent year over year, from $674,000 to $640,625, and per-foot prices eased from $707 to $687. At the same time closings rose from 189 to 218 and days on market fell from 83 to 69, so demand is improving even as prices soften.
On closed sales over the last 24 months, The Austonian at a $1,700,000 median and $1,057 per square foot. The Independent is next at $1,289,500 and $935 per foot.
Among buildings with meaningful volume, Milago at a $505,000 median and $488 per square foot, and 360 Condominiums at $525,000 and $624 per foot. Smaller units at Natiivo also close in the mid-$500,000s, but at a much higher $815 per square foot.
A 69-day median in 78701 over the last 12 months. By building it ranges widely: 48 days at The Independent, 71 at The Austonian, 74 at 360 Condominiums, and 120 to 154 days at 44 East Ave, Natiivo, Seaholm and Milago.
They vary by building and by unit size, and they are the number that decides affordability downtown more than the purchase price does. Rather than quote a range that will be wrong for your building, ask me for the current dues, the reserve position and any pending assessments for the specific tower you are considering.
It depends entirely on the building and on current city rules. Some towers are purpose-built for it; most restrict or prohibit it in their governing documents. Never assume — get the rules in writing during your option period, because this is the most common expensive surprise downtown.
Different products. Downtown 78701 condos run $687 per square foot with a 1,177-square-foot median unit; 78704 condos run $403 per foot with a 1,101-square-foot median. Downtown buys walkability and views; 78704 buys more space per dollar and lower dues.
Historically they have been more volatile, because supply can expand vertically in a way that single-family supply cannot. Over the last year single-family in central Austin ZIPs generally held or rose while downtown condo medians eased about 5 percent. Building selection matters more for condos than neighborhood selection does for houses.
Yes. I will pull every closed sale in your building for the last 24 months, adjust for floor, line, view and finish, and tell you where your unit sits — including how long comparable units actually took to sell.
Thinking about a downtown condo?
Tell me the building, or tell me the budget and the lifestyle and I will tell you which buildings to look at. You get closed comps by building, real dues numbers, and a straight read on resale velocity before you make an offer.
Or text CONDO to (512) 797-0965 and I will send the current numbers for your street.
Johnny Ronca
SERHANT. Luxury Associate Broker · Serhant Texas, LLC
20+ years in Austin real estate · 300+ closed transactions · $250M+ in career sales
(512) 797-0965 · [email protected] · johnnyronca.com
Source: Unlock MLS (ACTRIS) closed-sale data, pulled September 22, 2026. Figures are medians for closed single-family sales unless stated otherwise. Building-level figures group closed sales by MLS subdivision and address; buildings with fewer than ten sales in the period are directional rather than a stable index. Market statistics are reported in aggregate and are not a substitute for a written valuation of a specific home.
Your insider guide to buying smart in Austin's market. 11 chapters covering undervalued neighborhoods, 2/1 buydown strategies, off-market deals, school rankings, and expert tactics from a Top 1% agent with 270+ closed transactions.
Stay up to date on the latest real estate trends.

I am committed to guiding you every step of the way—whether you're buying a home, selling a property, or securing a mortgage. Whatever your needs, I've got you covered.
7415 SOUTHWEST PKWY BLDG 2 STE 200 AUSTIN TX 78620