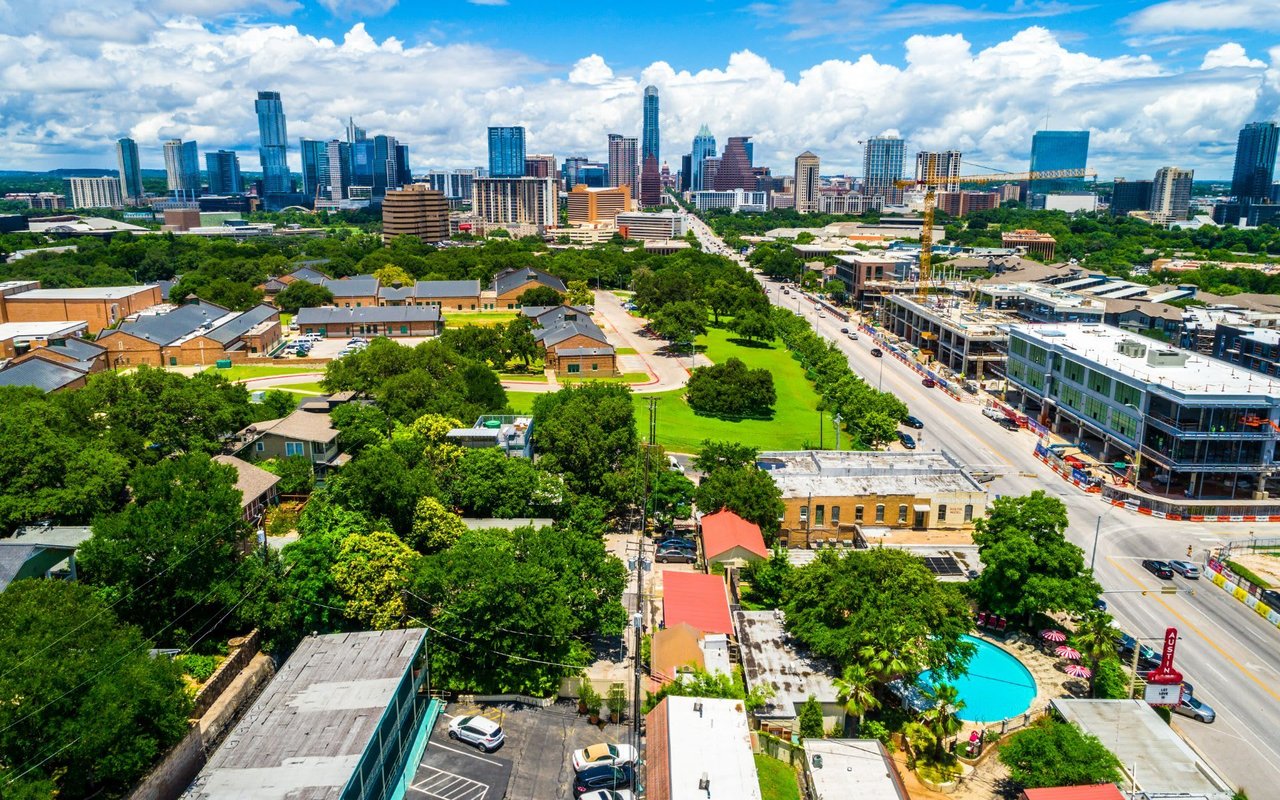
Austin vs San Francisco, LA and San Diego 2026: What Your Money Actually Buys
September 22, 2026
September 22, 2026
The 15-Second Answer
Austin’s median home price is about a third of San Francisco’s and roughly half of Los Angeles’ or San Diego’s — $549,636 against $1,591,447, $1,055,302 and $999,339 as of August 2026. Per square foot the gap is even starker: $307 in Austin against $1,070 in San Francisco. But the honest comparison has to include property taxes, which run far higher in Texas, and state income tax, which Texas does not have at all. Here is the whole math, plus what $1.5M, $3M and $5M actually buy you in Austin.
I am Johnny Ronca, a SERHANT. Luxury Associate Broker in Austin. A large share of my buyers move here from California, and almost every one of them arrives with the same two questions: how much further does my money go, and what is the catch. This page answers both with real numbers — city medians from Redfin as of August 2026, and Austin closing data straight out of Unlock MLS, pulled September 22, 2026.
City | Median sale price | Median $/sq ft | Median days on market | Year over year |
|---|---|---|---|---|
San Francisco | $1,591,447 | $1,070 | 20 | +13.7% |
Los Angeles | $1,055,302 | $621 | 52 | −1.4% |
San Diego | $999,339 | $687 | 27 | +5.2% |
Austin | $549,636 | $307 | 57 | −1.0% |
Redfin city-level medians for the three months ending August 2026. Austin figures here are Redfin’s citywide number; the MLS-based ZIP and neighborhood data further down comes from Unlock MLS.
Two observations most relocation articles skip. First, the California markets are currently rising and Austin is flat to slightly down, which means the gap has been narrowing, not widening, over the last year. Second, Austin’s 57-day median market time against San Francisco’s 20 tells you where the negotiating leverage lives. Austin buyers have time to think; San Francisco buyers do not.
In Westlake — the most expensive part of the metro — the $1.5M to $2M band closed at a $1,750,000 median on a 3,201-square-foot home over the last 12 months.
That is the top of the market. Move out of 78746 and $1.5 million buys considerably more. In Circle C (78739) the ZIP median is $815,000, in Cedar Park it is $500,500, and in Dripping Springs $615,000 — so $1.5 million in those markets buys a large custom home, usually on a real lot.
For scale: the median San Francisco home at $1,591,447 is a 1,487-square-foot property at $1,070 a foot. In Austin, $1.5 million at the citywide $307 per foot is a house roughly three times that size.
In 78746 the $2M to $3M band closed at a $2,482,000 median on a 4,220-square-foot home; the 4,000 to 6,000-square-foot band closed at a $3,065,000 median.
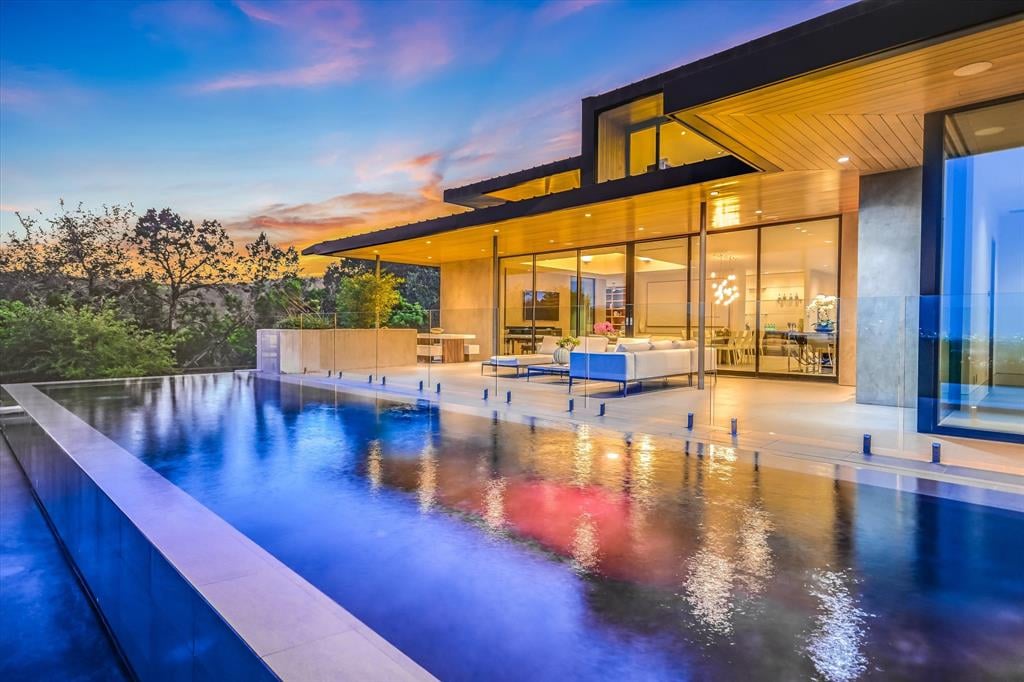
So three million dollars in Austin is a 4,000-to-6,000-square-foot house in the best school district in the metro, frequently with a pool — pool homes in 78746 and 78733 closed at a $2,635,000 median on 4,346 square feet. In San Francisco proper, $3 million is a very nice house and no acreage; in Los Angeles it is a solid home in a good neighborhood; in San Diego it buys real quality but not usually a view lot.
This is the band where California buyers notice the difference most. Not because Austin is cheap at $3M — it is not — but because $3M here reaches the top tier of neighborhoods like West Lake Hills, Barton Creek and Rob Roy, while $3M in coastal California is often mid-market.
In 78746 the $5M-plus band closed at a $6,218,750 median on a 6,426-square-foot home, at $1,071 per square foot — almost exactly San Francisco’s citywide median price per foot.
That comparison is worth sitting with. At the very top of the Austin market, you are paying roughly the same per square foot that the median San Francisco buyer pays for an ordinary home. The difference is what you get for it: 6,400 square feet, an acre or more, and in many cases a view or water frontage. Lake Austin waterfront ran a $5,050,000 median over the last 24 months at $1,194 a foot, on only 27 sales in two years.
What each price point reaches in Austin
Texas has no state income tax, and pays for it with property taxes that are roughly double California’s effective rate.
California’s Proposition 13 sets the base property tax at 1 percent of assessed value plus voter-approved local add-ons, and caps annual assessment increases at 2 percent while you own the home. Texas has no such cap on rate, and combined rates stack several jurisdictions: county, city, school district, community college and healthcare district.
For reference, Travis County’s own adopted rate for fiscal year 2026 is 37.58 cents per $100 of taxable value — and that is only the county’s slice. Add the city, the school district and the other entities and Austin-area combined rates generally land close to 2 percent of assessed value, before homestead exemptions. Confirm the exact rate and exemptions for any specific address with the Travis Central Appraisal District.
The practical math: on a $1,000,000 Austin home, a roughly 2 percent combined rate is about $20,000 a year before exemptions. On a $1,000,000 California home under Prop 13, closer to $11,000 to $12,500. That $8,000 annual gap is real money, and it is the number California buyers most often forget to model.
What offsets it: no state income tax in Texas against a California top marginal rate of 13.3 percent. For a high earner, that swing usually dwarfs the property tax difference. For a retiree living off assets with little taxable income, it may not.
On momentum, California. On value per dollar and negotiating room, Austin — by a wide margin.
San Francisco is up 13.7 percent year over year with a 20-day median market time. San Diego is up 5.2 percent. Los Angeles is down 1.4 percent. Austin is down about 1 percent with a 57-day median. If your only goal is to buy into a rising market this quarter, Austin is not that market.
If your goal is space, schools and a lower cost basis, the comparison is not close. Austin’s citywide $307 per square foot buys three times the house that San Francisco’s $1,070 does, and Eanes ISD — the metro’s top-rated district, with an A at 94 out of 100 from the state — closes at $550 per square foot, still half of San Francisco’s citywide median per foot.
And there is a timing argument. Austin has been flat to slightly negative for two years while California has resumed rising. Historically, the Austin markets I watch most closely — Westlake, Lake Travis, the central neighborhoods — turn on market time before they turn on price, and days on market in 78746 fell from 58 to 34 over the last year.
Patterns I see consistently. Tech and finance buyers coming from the Bay Area usually land in Westlake, Tarrytown or Barton Creek if schools are the priority, or downtown and East Austin if walkability is. Los Angeles and San Diego buyers who want water end up on Lake Travis or Lake Austin. Buyers optimizing purely for square footage per dollar go to Dripping Springs, Belterra or Leander.
Two pieces of advice I give every California buyer. First, rent for a few months if you can — the geography here is not obvious from a map, and the difference between the 620 corridor and central Austin is forty minutes of your life every day. Second, model the property tax bill at the new assessed value, not the seller’s current one. Texas reassesses on sale, and that surprise has soured more than one relocation.
Johnny's Off Market Private Luxury Listings
A real share of Austin luxury trades quietly. I work three private venues for high-end pocket listings, plus a list of agents I can call or text directly to ask what is coming before it hits the MLS. If you want to know what is available off market in a specific pocket, ask me and I will make the calls.
Substantially, on purchase price. As of August 2026 the Austin median was $549,636 against $1,591,447 in San Francisco, $1,055,302 in Los Angeles and $999,339 in San Diego. Per square foot Austin ran $307 against $1,070, $621 and $687. Property taxes are higher in Texas, which narrows but does not close the gap.
At the citywide $307 per square foot median, roughly 3,000 square feet, and in many suburban markets considerably more. In Westlake 78746, where the median is $582 per foot, closer to 1,700 to 2,000 square feet — though the sub-$1M band in 78746 is thin, at only 12 sales in the last year.
Travis County’s own FY2026 rate is 37.58 cents per $100 of value, and combined Austin-area rates across all taxing entities generally approach 2 percent of assessed value before exemptions. California’s Proposition 13 base rate is 1 percent plus local add-ons, with assessment increases capped at 2 percent a year. Verify any specific address with the Travis Central Appraisal District.
No. Texas has no state income tax. California’s top marginal state income tax rate is 13.3 percent. For high earners that difference usually outweighs the higher Texas property tax; for lower-income retirees it may not.
It depends on the submarket. Citywide the median is down about 1 percent year over year with a 57-day median market time. By ZIP, Northwest Hills is at 3.0 months of supply while Spicewood is at 16.8 and Lakeway at 7.3. The suburbs and the lake markets favor buyers; central and Westlake are closer to balanced.
I do not forecast prices, and anyone who gives you a confident number is guessing. What the data shows is that transaction volume and market time have both improved: 78746 closings rose 15 percent year over year and days on market fell from 58 to 34. Historically those move before price does.
None of them, honestly. The closest comparison people make is to a pre-2010 version of a coastal tech market: strong job base, limited central housing, rapid suburban expansion. What is genuinely different here is the land — lot sizes, Hill Country terrain and lake frontage that has no California equivalent at these prices.
Westlake 78746 closed at a $2,050,000 median and $582 per square foot over the 12 months ending September 2026. San Francisco’s citywide median was $1,591,447 at $1,070 per foot. The Westlake home is more expensive overall and roughly half the price per square foot.
I would strongly prefer you did, and I will tell you the same thing on a call. If you cannot, I will do video walkthroughs and give you an honest read on street, noise, terrain, flood risk and commute — the things photographs hide.
Yes, and a meaningful share of my business is exactly that. I will map your priorities — schools, commute, water, lot size, budget — onto actual neighborhoods, send closed comps so you can calibrate on real numbers, and flag the tax and insurance realities before you make an offer rather than after.
Moving to Austin from California?
Tell me your budget, your must-haves and where you are coming from. I will send you a short list of neighborhoods that actually fit, the closed comps in each one, and an honest estimate of your annual carrying costs including the property tax bill at the new assessed value.
Or text MOVE to (512) 797-0965 and I will send the current numbers for your street.
Johnny Ronca
SERHANT. Luxury Associate Broker · Serhant Texas, LLC
20+ years in Austin real estate · 300+ closed transactions · $250M+ in career sales
(512) 797-0965 · [email protected] · johnnyronca.com
Source: Unlock MLS (ACTRIS) closed-sale data, pulled September 22, 2026. Figures are medians for closed single-family sales unless stated otherwise. City-level medians for San Francisco, Los Angeles, San Diego and Austin are Redfin figures for the three months ending August 2026. Austin ZIP, neighborhood and band-level figures are from Unlock MLS closed sales pulled September 22, 2026. Tax rates are current published rates and change annually; confirm any specific property with the appraisal district. Market statistics are reported in aggregate and are not a substitute for a written valuation of a specific home.
Your insider guide to buying smart in Austin's market. 11 chapters covering undervalued neighborhoods, 2/1 buydown strategies, off-market deals, school rankings, and expert tactics from a Top 1% agent with 270+ closed transactions.
Stay up to date on the latest real estate trends.
I am committed to guiding you every step of the way—whether you're buying a home, selling a property, or securing a mortgage. Whatever your needs, I've got you covered.
7415 SOUTHWEST PKWY BLDG 2 STE 200 AUSTIN TX 78620